Global Developments on Regulatory Frameworks and Possible Harmonization
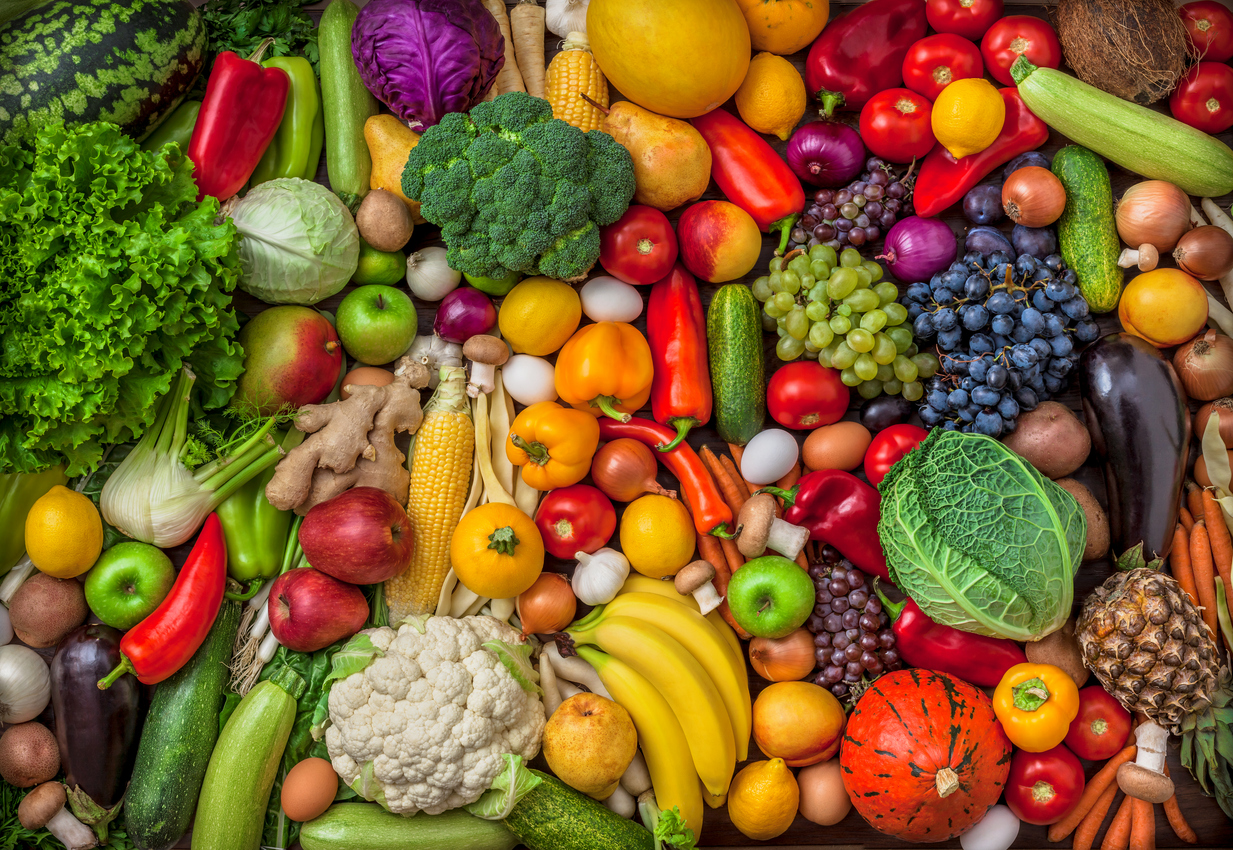
The world is facing a polycrisis that affects the economic, environmental, geopolitical, societal, and technological areas of life, slowing down the achievement of the United Nations (UN) Sustainable Development Goal (SDG) 2 to "End hunger, achieve food security and improved nutrition, and promote sustainable agriculture." The Food and Agriculture Organization of the United Nations (FAO) reports that food production must be increased by 70% to feed the growing population, which will reach 9.5 billion by 2050.1, 2
Blog Archive

Science Speaks is ISAAA Inc.'s official blog. Weekly blog articles, authored by ISAAA writers, partners, and invited contributors, aim to help share, disseminate, and promote scientific knowledge and its vital role in achieving global agricultural sustainability and development. Your support to Science Speaks will help us achieve this goal. You can help us by donating as little as $10.