Pocket K No. 5: Documented Benefits of GM Crops
The global area planted to GM crops has consistently increased over the past years. Substantial share of GM crops has been grown in developed countries. In the last few years, however, there has been a consistent increase in the number of hectares being planted to GM crops in the developing world. Fifty three percent (53%) or 103.1 million hectares of the total global GM crop area of 191.7 million hectares, was in developing countries in 2018. A significant increase in GM crop area was reported in developing countries of Africa, Asia, and Latin America. Experiences from these countries show that resource-poor farmers can also benefit from this technology.
This Pocket K documents some of the GM crop experiences of selected developing countries.
Global Impact of GM Crops
Farm Income
Biotech crops have had a positive impact on farm income worldwide due to enhanced productivity and efficiency gains. In 2016, direct global farm income benefit was $18.2 billion. Over the period of 21 years between 1996-2016, farm incomes have increased by $186.1 billion.1
| Global farm income benefits from growing GM crops, 1996-2016 (US$ million) | ||
| GM Trait | 2016 increase in farm income | 1996-2016 increase in farm income |
| HT soybean | 4,373.3 | 54,524.4 |
| HT+IR soybean | 2,490.9 | 5,211.5 |
| HT maize | 2,104.9 | 13,108.1 |
| HT cotton | 130.1 | 1,916.9 |
| HT canola | 509.9 | 5,970.9 |
| IR maize | 4,809.1 | 50,565.5 |
| IR cotton | 3,695.2 | 53,986.9 |
| Others | 81.5 | 817.9 |
| Totals | 18,194.9 | 186,102.1 |
Note: HT = herbicide tolerant, IR = insect resistant, others = virus-resistant papaya and squash, and herbicide tolerant sugar beet. (Source: G. Brookes and P. Barfoot, 2018) |
||
Pesticide Use
Since 1996, farmers planting biotech crops have reduced pesticide inputs in their fields by 8.2% or 671.2 million kg which led to an overall reduction in the environmental footprint of biotech crops by 18.4%. Environmental footprint is a measure of the effect or impact a product, process, operation, an individual or corporation places on the environment, in this case, measuring the environmental effects of pesticides.
The largest environmental gain was recognized with the use of GM insect resistant (IR) technology. GM IR cotton alone contributed a 43% reduction in the total volume of active ingredient used on GM crops and a 32.3% reduction in the total field Environmental Impact Quotient (EIQ). Adoption of GM IR maize also caused significant reductions in insecticide use (92.1 million kg of active ingredient), with associated environmental benefits.1
| Impact of changes in the use of herbicides and insecticides in GM crops globally, 1996-2016 | ||||
| GM Trait | Change in volume of AI used (million kg) | Change in field EIQ impact (million field EIQ/ha units) | % change in AI use on GM crops | % change in environmental impact associated with herbicide and insecticide use on GM crops |
| HT soybean | +13.0 | -8,526 | +0.4 | -13.4 |
| HT+IR soybean | -7.4 | -678 | -6.1 | -6.3 |
| HT maize | -239.3 | -7,859 | -8.1 | -12.5 |
| HT canola | -27.3 | -931 | -18.2 | -29.7 |
| HT cotton | -29.1 | -706 | -8.2 | -10.7 |
| IR maize | -92.1 | -4,142 | -56.1 | -58.6 |
| IR cotton | -288.0 | -12,762 | -29.9 | -32.3 |
| HT sugar beet | +1.0 | -43 | +9.9 | -19.4 |
| Totals | -671.2 | -35,647 | -8.2 | -18.4 |
Note: HT = herbicide tolerant, IR = insect resistant, Ai = active ingredient, EIQ = environmental impact quotient. (Environmental Impact Quotient (EIQ), a universal indicator where the various environmental impacts of individual pesticides are integrated into a single field value per hectare. This EIQ value is multiplied by the amount of pesticide active ingredient (ai) used per hectare to produce a field EIQ value.) |
||||
Developed Country Experiences
Several studies on GM crop adoption in North America and elsewhere highlighted the multiple benefits derived from GM crops. Examples are the following:
United States
- An estimate cost savings by farmers planting HT soybean was $73.1/ha in 2016, which is almost three times higher compared to the early years of adoption. The annual total national farm income benefit from HT soybean has dramatically risen from $5 million in 1996, to approximately $159.8 million in 2016.1
- The adoption of herbicide tolerant maize, which was slower in previous years, has accelerated, reaching 90 percent of U.S. corn acreage in 2019.5,1
- The total farm income benefits from 1996 to 2016 was $79,513.3 million.1
Canada
- HT canola has boosted the total canola production in Canada by almost 11% in 2016. Adopters of biotech canola earned $473 million in 2016.1
- The additional increase in farm income by HT maize farmers in 2016 was $23.7 million.1
- Canada is estimated to have enhanced farm income from biotech crops by $8.03 billion in the period 1996 to 2016.1
Spain
- Bt maize adoption in Spain in 2016 resulted in yield increases of 6.3% on average, the net impact on gross margin was $182.1 per hectare.1
- Farmers also experienced savings on pesticide use by $7.09/ha.1
Australia
- For 2016, Australian farmers planting IR cotton have significant cost savings of about $223.05/ha despite the high cost of technology. In 2015, net farm income at the national level was $103.74 million.1
Developing Country Experiences
Bt cotton adoption in India
Cotton is a very important crop for India. However, due to the high incidence of pests, especially the cotton bollworms, India falls short of the world’s average yield of cotton by 48%, an equivalent of 280 kg/ha2. Indian farmers often lose up to 50-60% of their crop to the cotton bollworm.10 With the commercialization of Bt cotton in India in 2002, the cyclic infestation of bollworm has been suppressed.
In 2018, Indian farmers planted biotech cotton on 11.6 million hectares, which is equal to 95% of the total cotton area grown in the country.2 Adoption of Bt cotton started in 2002 with 3 hybrids planted in six Indian states: Andhra Pradesh, Gujarat, Madhya Pradesh, Karnataka, Maharashtra and Tamil Nadu. The single gene hybrids have achieved a near phasing out because of the dual gene cotton hybrids which provided additional protection to various insect pests. Dual gene hybrids have also helped cotton farmers to earn a higher profit through cost savings associated with fewer sprays and increased yield of 8-10% higher than single gene IR cotton hybrids.2
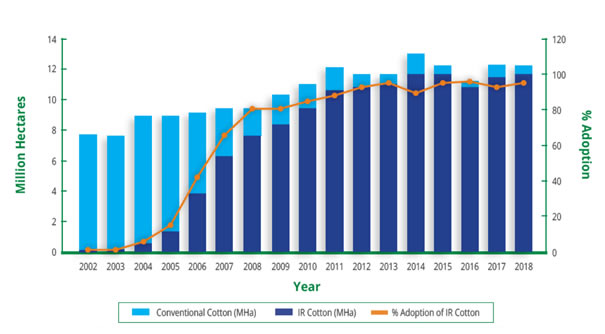
17 Years of Bt Cotton Adoption in India (2002-2018)
Fourteen studies on the impact of Bt cotton were conducted from 1998 to 2013. The results showed that yield increased by about 31% and insecticide spraying reduced by 39%, which translates to 88% increase in profitability (US$250/ha).
Qaim and Khouser (2013) conducted a study involving 1,431 farm households in India from 2002 to 2008 to investigate the effect of Bt cotton on farmers’ family income and food security. According to the findings, the adoption of Bt cotton has significantly improved calorie consumption and dietary quality, leading to increased family income. The technology reduced food insecurity by 15-20% among cotton-producing households.
Bt Corn Adoption in the Philippines
A common corn pest in the Philippines is the Asiatic corn borer, the cause of up to 80% of production losses. Across the country, corn yield levels averaged only 2.8 tons per hectare. The Philippine government approval of the commercial release of Bt corn marked the first time that a GM food/feed crop was ever approved for planting in Asia. Initial plantings of Bt corn for the first year commercialization (2003) covered more than 10,000 hectares. Together with other biotech corn varieties (herbicide tolerant and Bt/HT), the total hectarage in the wet and dry seasons in 2018 was estimated to be 630,000 hectares.
Adoption of Bt corn in the Philippines provided the following benefits to small-scale farmers:2,4,6
- Yield advantage of about 14.3 to 34% over conventional corn hybrids
- Pesticide cost reduction of about $12-$15/ha
- Profit gain of PhP10,132/ha (US$180), with PhP168/ha savings in insecticide costs
- Increased net profitability by 4-7% during wet season, and 3-9% during dry season
- Premium price for Bt corn because of good quality grains
In general, socio-economic studies on biotech corn confirmed that the technology has positive impact on small and resource-poor farmers and corn producers in the Philippines.
Conclusion
The increasing number of farmers who have grown GM crops both in the developed and developing countries is strong evidence of their advantages in agricultural production and value to farmers. After 23 years (1996-2018) of GM crop adoption, an accumulated hectarage of more than 2.5 billion hectares, were planted by 18 million farmers. This unprecedented high adoption rate reflects the trust and confidence of millions of farmers in crop biotechnology.11 Experiences of small farmers from India, the Philippines and other developing countries using GM crops clearly show that small farmers can also benefit from the technology. The most consistent observation from these countries is that growing GM crops is a profitable farming endeavor.
References
- Brookes, G. and P. Barfoot. 2018. GM Crops: Global Socio-economic and Environmental Impacts 1996-2016. PG Economics Ltd, UK. pp 1-204.
- ISAAA. 2018. Global Status of Commercialized Biotech/GM Crops: 2018. ISAAA Brief No. 54. ISAAA: Ithaca, NY.
- Yorobe, J.M., C.B. Quicoy, E.P. Alcantara and B.R. Sumayao. 2006. Impact assessment of Bt corn in the Philippines. Philippine Agricultural Scientist 89(3): 258-267.
- Sankula, S., G. Marmon, and E. Blumenthal. 2005. Biotechnology-Derived Crops Planted in 2004 - Impacts on US Agriculture. http://www.ncfap.org.
- U.S. Department of Agriculture Economic Research Service (USDA-ERS). 2019. Recent Trends in GE Adoption. https://www.ers.usda.gov/data-products/adoption-of-genetically-engineered-crops-in-the-us/recent-trends-in-ge-adoption/.
- Brookes, G. 2003. The farm level impact of using Bt maize in Spain. Crop Biotech Brief, 3(3), Global Knowledge Center on Crop Biotechnology, ISAAA SEAsiaCenter. https://www.isaaa.org/kc.
- J. Huang, R. Hu, S. Rozelle, and C. Pray. 2005. Insect-Resistant GM Rice in Farmers’ Fields: Assessing Productivity and Health Effects in China. Science, 308, 688-690.
- Sen, A. 2005. Cotton Scenario in India. www.indiaonestop.com/cotton/cotton.htm
- Shetty, PK. 2004. Socio-ecological Implications of Pesticide Use in India. Economic and Political Weekly, December 4, Vol 39, No 49, pp 5261-5267.
- Hsiaoping, C. 2005. Rice Consumption in China: Can China Change Rice Consumption from Quantity to Quality? Rice is life: scientific perspectives for the 21st century. Session 17. 497-499.
- Qaim, M. and S. Khouser. 2013. Genetically modified crops and food security. Plos One. June 5, 2013. http://www.plosone.org/article/info%3Adoi%2F10.1371%2Fjournal.pone.0064879.
*Updated April 2020
Next Pocket K: Bt Insect Resistant Technology
-
Foldable Version (PDF)
- English
- French (France)
- Thai
- Urdu
-
Document Version (PDF)
- English
- Vietnamese