Pocket K No. 16: Biotech Crop Highlights in 2019
| |
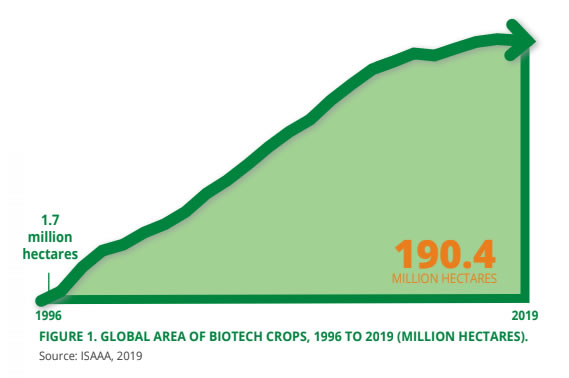
In 2019, the 24th year of commercialization of biotech crops, 190.4 million hectares of biotech crops were planted by up to 17 million farmers in 29 countries. From the initial planting of 1.7 million hectares in 1996 when the first biotech crop was commercialized, the 2019 planting indicates ~112-fold increase (Figure 1). Thus, biotech crops are considered as the fastest adopted crop technology in the history of modern agriculture.
Biotech Crops in Industrial and Developing Countries
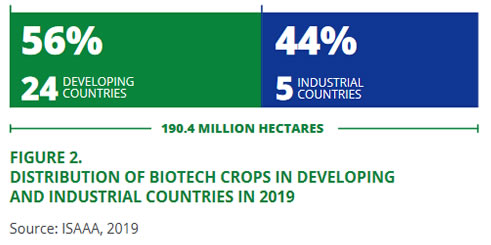
For the past eight years, developing countries have planted more biotech crops than industrial countries (Figure 2). In 2019, 24 developing countries planted 56% of the global biotech hectares, while 5 industrial countries took the 44% share. This trend is expected to continue in the upcoming years due to the increasing number of countries in the southern hemisphere adopting biotech crops and the commercialization of new biotech crops such as rice, which is mostly grown in developing countries.
Distribution of Biotech Crops, by Country
Of the 29 countries that planted biotech crops in 2019, 19 countries were considered as biotech mega-countries, which grew at least 50,000 hectares (Table 1). The USA remained as the top producer of biotech crops globally, which planted 71.5 million hectares in 2019. Brazil landed on the second spot, with 52.8 million hectares.
Table 1. Global Area of Biotech Crops in 2018 and 2019: by Country (million hectares)
Rank |
Country | 2018 | 2019 |
| 1 | USA* | 75 | 71.5 |
| 2 | Brazil* | 51.3 | 52.8 |
| 3 | Argentina* | 23.9 | 24 |
| 4 | Canada* | 12.7 | 12.5 |
| 5 | India* | 11.6 | 11.9 |
| 6 | Paraguay* | 3.8 | 4.1 |
| 7 | China* | 2.9 | 3.2 |
| 8 | South Africa* | 2.7 | 2.7 |
| 9 | Pakistan* | 2.8 | 2.5 |
| 10 | Bolivia* | 1.3 | 1.4 |
| 11 | Uruguay* | 1.3 | 1.2 |
| 12 | Philippines* | 0.6 | 0.9 |
| 13 | Australia* | 0.8 | 0.6 |
| 14 | Myanmar* | 0.3 | 0.3 |
| 15 | Sudan* | 0.2 | 0.2 |
| 16 | Mexico* | 0.2 | 0.2 |
| 17 | Spain* | 0.1 | 0.1 |
| 18 | Colombia* | 0.1 | 0.1 |
| 19 | Vietnam* | <0.1 | 0.1 |
| 20 | Honduras | <0.1 | <0.1 |
| 21 | Chile | <0.1 | <0.1 |
| 22 | Malawi | --- | <0.1 |
| 23 | Portugal | <0.1 | <0.1 |
| 24 | Indonesia | <0.1 | <0.1 |
| 25 | Bangladesh | <0.1 | <0.1 |
| 26 | Nigeria | --- | <0.1 |
| 27 | Eswatini | <0.1 | <0.1 |
| 28 | Ethiopia | --- | <0.1 |
| 29 | Costa Rica | <0.1 | <0.1 |
| Total | 191.7 | 190.4 |
*Biotech mega-countries which grew more than 50,000 hectares, or more.
**Rounded-off to the nearest hundred thousand.
Source: ISAAA, 2019
Global Adoption of Biotech Soybean, Maize, Cotton, and Canola
The most planted biotech crops in 2019 were soybean, maize, cotton, and canola. Although there was a 4% reduction in the planting of biotech soybean, it maintained its high adoption rate of 48% of the global biotech crops or 91.9 million hectares. This area was 74% of the total soybean production worldwide in 2019 (Figure 3).
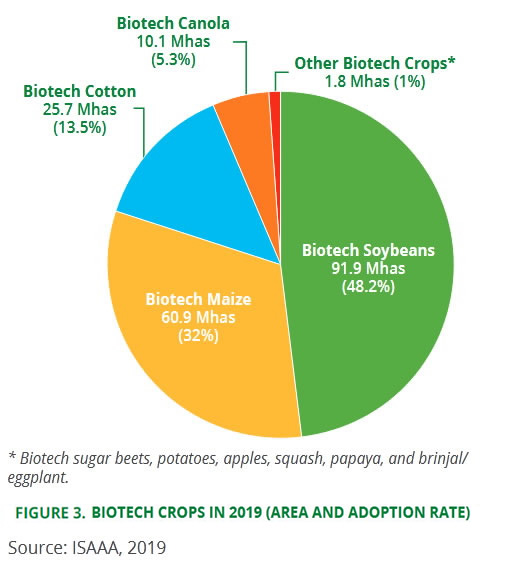
Biotech maize occupied 60.9 million hectares globally, which was 31% of the global maize production in 2019. Biotech cotton was planted to 25.7 million hectares, covering 79% of the global area of cotton in 2019. Biotech canola occupied 10.1 million hectares in 2019, which was 27% of the total canola production worldwide.
Aside from soybean, maize, cotton, and canola, the following biotech crops were also planted in different countries: alfalfa, sugar beets, sugarcane, papaya, safflower, potatoes, eggplant, squash, apple, and pineapple.
Documented Impact of Biotech Crops
About 17 million farmers, mostly from developing countries, adopted biotech crops because of the improvement in their socio-economic conditions. For the last 23 years (1996-2018), global economic gains from biotech crops reached US$224.9 billion.
Aside from the economic benefits, biotech crops also contributed significantly to food security, sustainable development, and climate change mitigation from 1996 to 2018 through the following:
- increasing crop productivity by 822 million tons;
- conserving biodiversity by saving 231 million hectares of land;
- providing a safer environment by saving 776 million kg of pesticides from being released into the environment;
- reducing CO2 emissions by 23 billion kg, equivalent to taking 15.3 million cars off the road for one year (2018); and
- helping alleviate poverty through uplifting the economic situation of 16-17 million small farmers, and their families totaling >65 million people (2018).
Future Prospects
The continuous adoption of biotech crops for 24 years has contributed to alleviation of global problems of poverty, malnutrition, food insecurity, crop diseases, and climate change. In 2019, the accumulated biotech crop area has reached 2.7 billion hectares (6.7 million acres) since 1996. Scientists all over the world are also combining their efforts to develop new biotech crops and traits that will be beneficial to farmers and consumers.
With public engagement initiatives to ensure public acceptance and facilitate enabling policies, the numerous benefits of biotechnology will continue to provide solutions and opportunities to resource-poor farmers and their families, as well as the growing global population in need of sustainable resources for survival.
To purchase an electronic copy of full Brief 55, send an e-mail to publications@isaaa.org. You can also request for a sample report.
| |
Reference:
- ISAAA. 2019. Global Status of Commercialized Biotech/GM Crops: 2019. ISAAA Brief No. 55. ISAAA: Ithaca, NY.
- Brookes G and P Barfoot. 2020. GM Crops: Global Socio-economic and Environmental Impacts 1996-2018. https://pgeconomics.co.uk/pdf/globalimpactfinalreportJuly2020.pdf.
* Updated May 2021