|
ISAAA Brief 35-2006: Executive Summary
Global Status of Commercialized Biotech/GM Crops: 2006
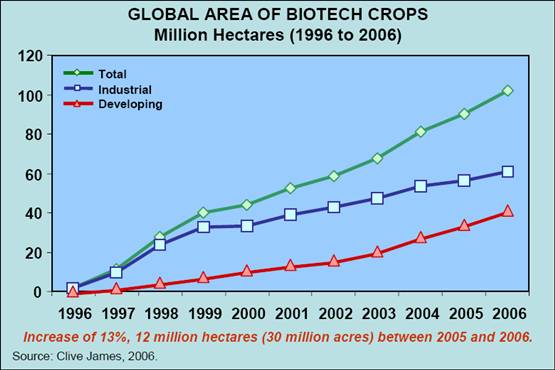
- In 2006, the first year of the second decade of commercialization of biotech crops 2006-2015, the global area of biotech crops continued to climb for the tenth consecutive year at a sustained double-digit growth rate of 13%, or 12 million hectares (30 million acres), reaching 102 million hectares (252 million acres). This is a historical landmark in that it is the first time for more than 100 million hectares of biotech crops to be grown in any one year. In order to appropriately account for the use of two or three "stacked traits", that confer multiple benefits in a single biotech variety, the 102 million hectares expressed as "trait hectares" is 117.7 million, which is 15% higher than the estimate of 102 million hectares.
- Biotech crops achieved several milestones in 2006: annual hectarage of biotech crops exceeded 100 million hectares (250 million acres); for the first time, the number of farmers growing biotech crops (10.3 million) exceeded 10 million; the accumulated hectarage from 1996 to 2006 exceeded half a billion hectares at 577 million hectares (1.4 billion acres), with an unprecedented 60-fold increase between 1996 and 2006, making it the fastest adopted crop technology in recent history.
- It is notable that the year-to-year increase of 12 million hectares in 2006 is the second highest in the last 5 years in absolute area, despite the fact that the adoption rates in the US, the principal grower of biotech crops, are already over 80% for soybean and cotton. It is also noteworthy that in 2006, India, the largest cotton growing country in the world, registered the highest proportional increase with an impressive gain that almost tripled its Bt cotton area to 3.8 million hectares.
- In 2006, the number of countries planting biotech crops increased from 21 to 22 with the EU country Slovakia, planting Bt maize for the first time and bringing the total number of countries planting biotech crops in the EU to six out of 25. Spain continued to be the lead country in Europe planting 60,000 hectares in 2006. Importantly, the collective Bt maize hectarage in the other five countries (France, Czech Republic, Portugal, Germany, and Slovakia) increased over 5-fold from approximately 1,500 hectares in 2005 to approximately 8,500 hectares, albeit on small hectarages, and growth in these five countries is expected to continue in 2007.
- 10.3 million farmers from 22 countries planted biotech crops in 2006, up from 8.5 million farmers in 2005. Of the 10.3 million, 90% or 9.3 million (up significantly from 7.7 million in 2005) were small, resource-poor farmers from developing countries whose increased income from biotech crops contributed to their poverty alleviation. Of the 9.3 million small farmers, most of whom were Bt cotton farmers, 6.8 million were in China, 2.3 million in India, 100,000 in the Philippines, several thousand in South Africa, with the balance in the other seven developing countries which grew biotech crops in 2006. This initial modest contribution of biotech crops to the Millennium Development Goal of reducing poverty by 50% by 2015 is an important development, which has enormous potential in the second decade of commercialization from 2006 to 2015.
- A new biotech crop, herbicide tolerant alfalfa, was commercialized for the first time in the US in 2006. RR® alfalfa has the distinction of being the first perennial biotech crop to be commercialized and was seeded on 80,000 hectares, or 5% of the 1.3 million hectares of alfalfa probably seeded in the US in 2006. RR® Flex herbicide tolerant cotton was launched in 2006 occupying a substantial area of over 800,000 hectares in its first year and was planted as a single trait and as a stacked product with Bt, with the latter occupying the majority of the hectarage. The plantings were principally in the US with a smaller hectarage in Australia. Notably in China, a locally developed virus resistant papaya, a fruit/food crop, was recommended for commercialization in late 2006.
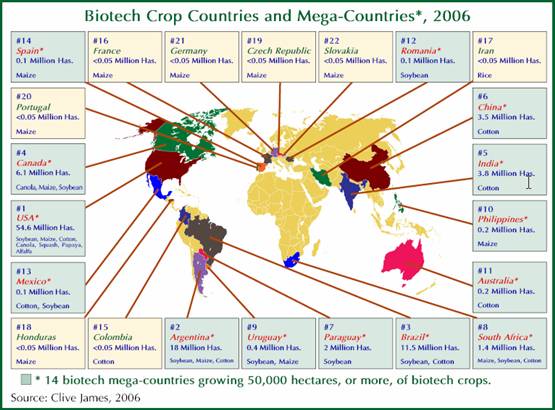
- In 2006, the 22 countries growing biotech crops comprised 11 developing countries and 11 industrial countries; they were, in order of hectarage, USA, Argentina, Brazil, Canada, India, China, Paraguay, South Africa, Uruguay, Philippines, Australia, Romania, Mexico, Spain, Colombia, France, Iran, Honduras, Czech Republic, Portugal, Germany, and Slovakia. Notably, the first eight of these countries grew more than 1 million hectares each - this provides a broad and stable foundation for future global growth of biotech crops.
- For the first time, India grew more Bt cotton (3.8 million hectares) than China (3.5 million hectares) and moved up the world ranking by two places to number 5 in the world, overtaking both China and Paraguay.
- It is noteworthy that more than half (55% or 3.6 billion people) of the global population of 6.5 billion live in the 22 countries where biotech crops were grown in 2006 and generated significant and multiple benefits. Also, more than half (52% or 776 million hectares) of the 1.5 billion hectares of cropland in the world is in the 22 countries where approved biotech crops were grown in 2006.
- In 2006, the US, followed by Argentina, Brazil, Canada, India, and China continued to be the principal adopters of biotech crops globally, with 54.6 million hectares planted in the US (53% of global biotech area) of which approximately 28% were stacked products containing two or three traits. The stacked products, currently deployed in the US, Canada, Australia, Mexico, South Africa and the Philippines, are an important and growing future trend, which meets the multiple yield constraints of farmers.
- The largest absolute increase in biotech crop area in any country in 2006 was in the US estimated at 4.8 million hectares, followed by India at 2.5 million hectares, Brazil with 2.1 million hectares, with Argentina and South Africa tying at 0.9 million hectares each. The largest proportional or percentage increase was in India at 192% (almost a three-fold increase from 1.3 million hectares in 2005 to 3.8 million hectares in 2006) followed closely by South Africa at 180% with an impressive increase in its biotech white and yellow maize area, and the Philippines at 100% increase, also due to a significant increase in its biotech maize area.
- Biotech soybean continued to be the principal biotech crop in 2006, occupying 58.6 million hectares (57% of global biotech area), followed by maize (25.2 million hectares at 25%), cotton (13.4 million hectares at 13%) and canola (4.8 million hectares at 5% of global biotech crop area).
- From the genesis of commercialization in 1996, to 2006, herbicide tolerance has consistently been the dominant trait followed by insect resistance and stacked genes for the two traits. In 2006, herbicide tolerance, deployed in soybean, maize, canola, cotton and alfalfa occupied 68% or 69.9 million hectares of the global biotech 102 million hectares, with 19.0 million hectares (19%) planted to Bt crops and 13.1 million hectares (13%) to the stacked traits of Bt and herbicide tolerance. The stacked product was the fastest growing trait group between 2005 and 2006 at 30% growth, compared with 17% for insect resistance and 10% for herbicide tolerance.
- During the period 1996 to 2006, the proportion of the global area of biotech crops grown by developing countries has increased consistently every year. Forty percent of the global biotech crop area in 2006, equivalent to 40.9 million hectares, was grown in developing countries where growth between 2005 and 2006 was substantially higher (7.0 million hectares or 21% growth) than industrial countries (5.0 million hectares or 9% growth). The increasing collective impact of the five principal developing countries (India, China, Argentina, Brazil and South Africa) representing all three continents of the South, Asia, Latin America, and Africa, is an important continuing trend with implications for the future adoption and acceptance of biotech crops worldwide.
- In the first 11 years, the accumulated global biotech crop area was 577 million hectares or 1.4 billion acres, equivalent to over half of the total land area of the USA or China, or 25 times the total land area of the UK. High adoption rates reflect farmer satisfaction with the products that offer substantial benefits ranging from more convenient and flexible crop management, lower cost of production, higher productivity and/or net returns per hectare, health and social benefits, and a cleaner environment through decreased use of conventional pesticides, which collectively contribute to a more sustainable agriculture. The continuing rapid adoption of biotech crops reflects the substantial and consistent improvements for both large and small farmers, consumers and society in both industrial and developing countries.
- The most recent survey1 of the global impact of biotech crops for the decade 1996 to 2005, estimates that the global net economic benefits to biotech crop farmers in 2005 was $5.6 billion, and $27 billion ($13 billion for developing countries and $14 billion for industrial countries) for the accumulated benefits during the period 1996 to 2005; these estimates include the benefits associated with the double cropping of biotech soybean in Argentina. The accumulative reduction in pesticides for the decade 1996 to 2005 was estimated at 224,300 MT of active ingredient, which is equivalent to a 15% reduction in the associated environmental impact of pesticide use on these crops, as measured by the Environmental Impact Quotient (EIQ) - a composite measure based on the various factors contributing to the net environmental impact of an individual active ingredient.
- The serious and urgent concerns about the environment highlighted in the 2006 Stern Report on Climate Change2, have implications for biotech crops which can potentially contribute to reduction of greenhouse gases and climate change in three principal ways. First, permanent savings in carbon dioxide emissions through reduced use of fossil-based fuels, associated with fewer insecticide and herbicide sprays; in 2005 this was an estimated saving of 962 million kg of carbon dioxide (CO2), equivalent to reducing the number of cars on the roads by 0.43 million. Secondly, conservation tillage (need for less or no ploughing with herbicide tolerant biotech crops) for biotech food, feed and fiber crops, led to an additional soil carbon sequestration equivalent in 2005 to 8,053 million kg of CO2, or removing 3.6 million cars off the road. Thus, in 2005 the combined permanent and additional savings through sequestration was equivalent to a saving of 9,000 million kg of CO2 or removing 4 million cars from the road. Thirdly, in the future, cultivation of a significant additional area of biotech-based energy crops to produce ethanol and biodiesel will, on the one-hand, substitute for fossil fuels and on the other, will recycle and sequester carbon. Recent research indicates that biofuels could result in net savings of 65% in energy resource depletion. Given that energy crops will likely occupy a significant additional crop hectarage in the future, the contribution of biotech-based energy crops to climate change could be significant.
Table 1. Global Area of Biotech Crops in 2006: by Country (Million Hectares)
Rank |
Country |
Area (million hectares) |
Biotech Crops |
|
|
|
|
1* |
USA |
54.6 |
Soybean, maize, cotton, canola, squash, papaya, alfalfa |
2* |
Argentina |
18.0 |
Soybean, maize, cotton |
3* |
Brazil |
11.5 |
Soybean, cotton |
4* |
Canada |
6.1 |
Canola, maize, soybean |
5* |
India |
3.8 |
Cotton |
6* |
China |
3.5 |
Cotton |
7* |
Paraguay |
2.0 |
Soybean |
8* |
South Africa |
1.4 |
Maize, soybean, cotton |
9* |
Uruguay |
0.4 |
Soybean, maize |
10* |
Philippines |
0.2 |
Maize |
11* |
Australia |
0.2 |
Cotton |
12* |
Romania |
0.1 |
Soybean |
13* |
Mexico |
0.1 |
Cotton, soybean |
14* |
Spain |
0.1 |
Maize |
15 |
Colombia |
<0.1 |
Cotton |
16 |
France |
<0.1 |
Maize |
17 |
Iran |
<0.1 |
Rice |
18 |
Honduras |
<0.1 |
Maize |
19 |
Czech Republic |
<0.1 |
Maize |
20 |
Portugal |
<0.1 |
Maize |
21 |
Germany |
<0.1 |
Maize |
22 |
Slovakia |
<0.1 |
Maize |
|
|
|
|
Source: Clive James, 2006. |
* 14 biotech mega-countries growing 50,000 hectares, or more, of biotech crops |
- While 22 countries planted commercialized biotech crops in 2006, an additional 29 countries, totaling 51, have granted regulatory approvals for biotech crops for import for food and feed use and for release into the environment since 1996. A total of 539 approvals has been granted for 107 events for 21 crops. Thus, biotech crops are accepted for import for food and feed use and for release into the environment in 29 countries, including major food importing countries like Japan, which do not plant biotech crops. Of the 51 countries that have granted approvals for biotech crops, the US tops the list followed by Japan, Canada, South Korea, Australia, the Philippines, Mexico, New Zealand, the European Union and China. Maize has the most events approved (35) followed by cotton (19), canola (14), and soybean (7). The event that has received regulatory approval in most countries is herbicide tolerant soybean event GTS-40-3-2 with 21 approvals (EU=25 counted as 1 approval only), followed by insect resistant maize (MON 810) and herbicide tolerant maize (NK603) both with 18 approvals, and insect resistant cotton (MON 531/757/1076) with 16 approvals worldwide.
- The overview of biofuels in this Brief serves to introduce the subject, and is focused on the implications of the growing interest and investments in biofuels in relation to two specific topics: crop biotechnology and developing countries. It is evident that biotechnology offers very significant advantages for increasing efficiency of biofuel production in both industrial and developing countries. It is expected that biotechnology and other improvements will allow industrial countries, like the US, to continue to produce surplus supplies of food, feed and fiber and coincidentally achieve ambitious goals for biofuels in the near-term. Any investment in food crops for biofuels in food insecure developing countries must not compete, but complement the programs in place for food, feed and fiber security. Any program developed in biofuels must be sustainable in terms of agricultural practice and forest management, the environment, and the ecosystem, particularly the responsible and efficient use of water. Most developing countries, with the exception of countries like Brazil which is a world leader in biofuels, would benefit significantly from forging strategic partnerships with public and private sector organizations from both industrial countries and the advanced developing countries, which are knowledgeable and experienced in the production, distribution and consumption of biofuels. Biofuels should not only benefit the national economy of a developing country but also benefit the poorest people in the country, who are mainly in the rural areas, most of whom are small resource-poor subsistence farmers and the landless rural labor who are entirely dependent on agriculture and forestry for their livelihoods.
- The future for biotech crops looks encouraging with the number of countries adopting the four current major biotech crops expected to grow, and their global hectarage and number of farmers planting biotech crops expected to increase as the first generation of biotech crops is more widely adopted and the second generation of new applications for both input and output traits becomes available. The outlook for the next decade of commercialization, 2006 to 2015, points to continued growth in the global hectarage of biotech crops, up to 200 million hectares, with at least 20 million farmers growing biotech crops in up to 40 countries, or more, by 2015. Genes conferring a degree of drought tolerance, expected to become available around 2010-2011, are projected to have substantial impact relative to current input traits and will be particularly important for developing countries which suffer more from drought, the most prevalent and important constraint to increased crop productivity worldwide. The second decade of commercialization, 2006-2015, is likely to feature significantly more growth in Asia compared with the first decade, which was the decade of the Americas, where there will be continued growth in stacked traits in North America and strong growth in Brazil. The mix of crop traits will become richer with quality traits making their long awaited debut with implications for acceptance, particularly in Europe. A 2006 study by the International Food Information Council (IFIC)3 in the US confirmed that the vast majority are confident in the safety of the US food supply and express little to no concern about food and agricultural biotechnology, and would selectively buy biotech- based products with high omega-3 oil content. Other products including pharmaceutical products, oral vaccines, and specialty products will also feature. By far, the most important potential contribution of biotech crops will be their contribution to the humanitarian Millennium Development Goals (MDG) of reducing poverty and hunger by 50% by 2015. The use of biotechnology to increase efficiency of first generation food/feed crops and second-generation energy crops for biofuels will have high impact and present both opportunities and challenges. Injudicious use of the food/feed crops, sugarcane, cassava and maize for biofuels in food insecure developing countries could jeopardize food security goals if the efficiency of these crops cannot be increased through biotechnology and other means, so that food, feed and fuel goals can all be met. Adherence to good farming practices with biotech crops, such as rotations and resistance management, will remain critical as it has been during the first decade. Continued responsible stewardship must be practiced, particularly by the countries of the South, which will be the major new deployers of biotech crops in the second decade of commercialization of biotech crops, 2006 to 2015.
The Global Value of the Biotech Crop Market
In 2006, the global market value of biotech crops, estimated by Cropnosis, was $6.15 billion representing 16% of the $38.5 billion global crop protection market in 2006 and 21% of the ~$30 billion 2006 global commercial seed market. The $6.15 billion biotech crop market comprised of $2.68 billion for biotech soybean (equivalent to 44% of global biotech crop market), $2.39 billion for biotech maize (39%), $0.87 billion for biotech cotton (14%), and $0.21 billion for biotech canola (3%). The market value of the global biotech crop market is based on the sale price of biotech seed plus any technology fees that apply. The accumulated global value for the eleven-year period, since biotech crops were first commercialized in 1996, is estimated at $35.5 billion. The global value of the biotech crop market is projected at over $6.8 billion for 2007.
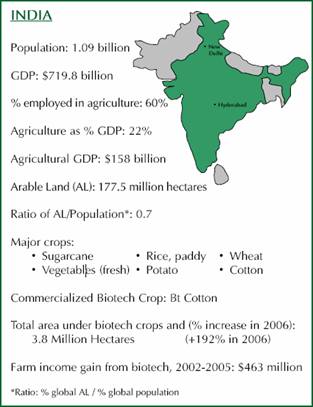
Focus India
Largest proportional increase in 2006 – almost a 3-fold increase to 3.8 million hectares
India, the largest democracy in the world, is highly dependent on agriculture which generates almost one quarter of its GDP and provides two thirds of its people with their means of survival. India is a nation of small resource-poor farmers, most of whom do not make enough income to cover their meager basic needs and expenditures. The National Sample Survey 4 last conducted in 2003, reported that 60.4% of rural households were engaged in farming indicating that there are 89.4 million farmer households in India. Sixty percent of the farming households own less than 1 hectare of land, and only 5% own more than 4 hectares. Only the 5 million farming households (5% of 90 million) have an income that is greater than their expenditures. The average income of farm households in India (based on 45 Rupees per US Dollar) was $46 per month and the average consumption expenditures was $62. Thus, of the 90 million farmer households in India, approximately 85 million, which represent about 95% of all farmers, are small resource-poor farmers who do not make enough money from the land to make ends meet - in the past, these included the vast majority of the 5 million or more Indian cotton farmers. India has a larger area of cotton than any country in the world - 9 million hectares cultivated by approximately 5 to 5.5 million farmers. Whereas India's cotton area represents 25% of the global area of cotton, in the past it produced only 12% of world production because Indian cotton yields were some of the lowest in the world.
Bt cotton, which confers resistance to important insect pests of cotton, was first adopted in India as hybrids in 2002. India grew approximately 50,000 hectares of officially approved Bt cotton hybrids for the first time in 2002, and doubled its Bt cotton area to approximately 100,000 hectares in 2003. The Bt cotton area increased again four-fold in 2004 to reach over half a million hectares. In 2005, the area planted to Bt cotton in India continued to climb reaching 1.3 million hectares, an increase of 160% over 2004.
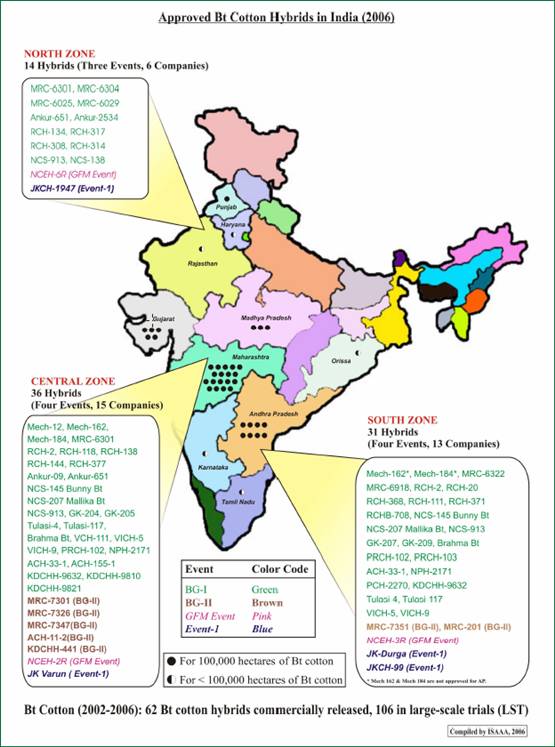
In 2006, the record increases in adoption in India continued with almost a tripling of area of Bt cotton from 1.3 million hectares to 3.8 million hectares. In 2006, this tripling in area was the highest year-on-year growth for any country in the world. Of the 6.3 million hectares of hybrid cotton in India in 2006, which represents 70% of all the cotton area in India, 60% or 3.8 million hectares was Bt cotton - a remarkably high proportion in a fairly short period of five years. The distribution of Bt cotton in the major growing states in 2004, 2005 and 2006 is shown in Table 2. The major states growing Bt cotton in 2006, listed in order of hectarage, are Maharashtra (1.840 million hectares representing almost half, 48% of all Bt cotton in India in 2006) followed by Andhra Pradesh (830,000 hectares or 22%), Gujarat (470,000 hectares or 12%), Madhya Pradesh (310,000 hectares or 8%), and 215,000 hectares (6%) in the Northern Zone and the balance in Karnataka and Tamil Nadu and other states.
Table 2. Adoption of Bt Cotton in India, by Major State, in 2004, 2005, and 2006 (‘000 hectares)
State |
2004 |
2005 |
2006 |
|
|
|
|
Maharashtra |
200 |
607 |
1,840 |
Andhra Pradesh |
75 |
280 |
830 |
Gujarat |
122 |
150 |
470 |
Madhya Pradesh |
80 |
146 |
310 |
Northern Zone* |
- - |
60 |
215 |
Karnataka |
18 |
30 |
85 |
Tamil Nadu |
5 |
27 |
45 |
Other |
- - |
- - |
5 |
|
|
|
|
Total |
500 |
1,300 |
3,800 |
|
|
|
|
* Punjab, Haryana, Rajasthan |
Source: ISAAA, 2006. |
The number of events, as well as the number of Bt cotton hybrids and companies marketing approved hybrids increased from one event and 20 hybrids in 2005 by more than three-fold in 2006 to four events and 62 hybrids (see map below).
It is estimated that in India, approximately 2.3 million small farmers planted on average 1.65 hectares of Bt cotton in 2006. The number of farmers growing Bt cotton hybrids in India has increased from 300,000 small farmers in 2004 to 1 million in 2005, with over a two-fold increase in 2006 to 2.3 million farmers, who are reaping significant benefits from the technology. Coincidental with the steep increased adoption of Bt cotton between 2002 and 2005, the average yield of cotton in India, which had one of the lowest yields in the world, increased from 308 kg per hectare in 2001-02 to 450 kg per hectare in 2005-2006, with most of the increase in yield of up to 50% or more attributed to Bt cotton.
The work of Bennett et al.5 confirmed that the principal gain from Bt cotton in India is the significant yield gains estimated at 45% in 2002, and 63% in 2001, for an average of 54% over the two years. Taking into account the decrease in application of insecticides for bollworm control, which translates into a saving, on average, of 2.5 sprays, and the higher cost of Bt cotton seed, Brookes and Barfoot estimate that the net economic benefits for Bt cotton farmers in India were $139 per hectare in 2002, $324 per hectare in 2003, $171 per hectare in 2004, and $260 per hectare in 2005, for a four year average of approximately $225 per hectare. The benefits at the farmer level translated to a national gain of $339 million in 2005 and accumulatively $463 million for the period 2002 to 2005. Other studies report results in the same range, acknowledging that benefits will vary from year to year due to varying levels of bollworm infestations. The most recent study6 by Gandhi and Namboodiri report a yield gain of 31%, a significant reduction in the number of pesticide sprays by 39%, and an 88% increase in profit or an increase of $250 per hectare for the 2004 cotton growing season.
For more details on India, please see full version of Brief 35 in which more comprehensive profiles of key biotech crop growing countries are also featured.
1 GM Crops: The First Ten Years - Global Socio-economic and Environmental Impacts by Graham Brookes and Peter Barfoot, P.G. Economics. 2006
2 3 Stern Review on the Economics of Climate Change, UK 2006 (www.sternreview.org.uk).
4 National Sample Survey, Organization's Situation Assessment Survey of farmers (NSS, 59th Round), India, 2003
5 Bennett R, Ismael Y, Kambhampati U, and Morse S (2004) Economic Impact of Genetically Modified Cotton in India, Agbioforum Vol 7, No 3, Article 1
6 Gandhi V and Namboodiri N.V., "The Adoption and Economics of Bt Cotton in India: Preliminary Results from a Study", IIMA Working Paper No. 2006-09-04, pp 1-27, Sept 2006
|