ISAAA
Briefs No. 32-2004: Executive Summary
Global
Status of Commercialized Biotech/GM Crops: 2004
Biotech
Crop Area by Country, Crop and Trait
- Countries
that grow 50,000 hectares, or more, of biotech crops are classified
as biotech mega-countries. In 2004, there were 14 mega-countries,
compared with 10 in 2003, with Paraguay, Spain, Mexico and the Philippines
joining the mega- country group for the first time in 2004. This 40%
increase in the number of mega-countries reflects a more balanced and
stabilized participation of a broader group of countries adopting biotech
crops. The 14 mega-countries, in descending order of hectarage of biotech
crops, were: USA with 47.6 million hectares (59% of global total), followed
by Argentina with 16.2 million hectares (20%), Canada 5.4 million hectares
(6%), Brazil 5.0 million hectares (6%), China 3.7 million hectares (5%),
Paraguay with 1.2 million hectares (2%) reporting biotech crops for the
first time in 2004, India 0.5 million hectares ((1%), South Africa 0.5
million hectares (1%), Uruguay 0.3 million hectares (<1%), Australia
0.2 million hectares (<1%), Romania 0.1 million hectares (<1%),
Mexico 0.1 million hectares (<1%), Spain 0.1 million hectares (<1%),
and the Philippines 0.1 million hectares (<1%).
- Based
on annual percentage growth in area, of the eight leading biotech crop
countries, India had the highest percentage year-on-year growth
in 2004 with an increase of 400% in Bt cotton area over 2003, followed
by Uruguay (200%), Australia (100%), Brazil (66%), China (32%), South
Africa (25%), Canada (23%) Argentina (17%) and the USA at 11%. In 2004,
India increased its area of approved Bt cotton, introduced only two years
ago, from approximately 100,000 hectares in 2003 to 500,000 hectares
in 2004 when approximately 300,000 small farmers benefited from Bt cotton.
Whereas growth in Uruguay in 2004 was accentuated by a conservative 2003
adoption rate, biotech soybean now occupies >99 % of the total soybean
area in Uruguay, plus a significant increase in biotech maize taking
the total biotech crop area above 300,000 hectares. After suffering severe
drought for the last two years, Australia increased its total cotton
plantings to about 310,000 hectares of which 80%, equivalent to 250,000
hectares, were planted with biotech cotton in 2004. Brazil increased
its biotech soybean area by two-thirds from 3 million hectares in 2003
to a projected conservative 5 million hectares in 2004, with another
significant increase likely in 2005. China increased its Bt cotton area
for the seventh consecutive year; an increase of one-third from 2.8 million
hectares in 2003 to 3.7 million hectares in 2004, equivalent to 66% of
the total cotton area of 5.6 million hectares in 2004, the largest national
cotton hectarage planted in China since the introduction of Bt cotton
in 1997. South Africa reported a 25% increase in its combined area of
biotech maize, soybean and cotton to 0.5 million hectares in 2004; growth
continued in both white maize used for food, and yellow maize used for
feed, as well as strong growth in biotech soybean, up from 35% adoption
in 2003 to 50% in 2004, whilst Bt cotton has stabilized at about 85%
adoption. Canada increased its combined area of biotech canola, maize
and soybean by 23% with a total of 5.4 million hectares with 77% of its
canola hectarage planted to biotech varieties. The adoption of herbicide
tolerant soybeans in Argentina, which was close to 100% in 2003, continued
to climb in 2004 as total plantings of soybean increased, which along
with biotech maize and cotton reached an all time high of 16.2 million
hectares of biotech crops. In the USA, there was an estimated net gain
of 11% of biotech crops in 2004, as a result of significant increases
in the area of biotech maize, followed by biotech soybean, with modest
growth in biotech cotton which started to peak in the USA in 2004 as
adoption approached 80%. In 2004, for the first time, Paraguay reported
1.2 million hectares of biotech soybean, equivalent to 60% of its national
soybean hectarage of 2 million hectares. Spain, the only EU country to
grow a significant hectarage of a commercial biotech crop, increased
its Bt maize area by over 80% from 32,000 hectares in 2003 to 58,000
hectares in 2004, equivalent to 12% of the national maize crop. In Eastern
Europe, Romania, which is a biotech mega-country, growing more than 50,000
hectares of biotech soybean, also reported significant growth. Bulgaria
and Indonesia did not report biotech maize and cotton, respectively in
2004 due to expiry of permits. Two countries, Mexico and the Philippines
which attained the status of biotech mega-countries for the first time
in 2004 reported 75,000 hectares and 52,000 hectares of biotech crops,
respectively for 2004. Other countries that have only recently introduced
biotech crops, such as Colombia and Honduras reported modest growth,
whilst Germany planted a token hectarage of Bt maize.
- Globally,
in 2004, growth continued in all four commercialized biotech crops.
Biotech soybean occupied 48.4 million
hectares (60% of
global biotech area), up from 41.4 million hectares in 2003. Biotech
maize was planted on 19.3 million hectares (23% of global biotech crop
area), up substantially from 15.5 million hectares in 2003, co-sharing
the highest growth rate with cotton at 25% - this follows a 25% growth
rate in biotech maize in 2003 and 27% in 2002. Biotech maize is projected
to have the highest percentage growth rate for the near term as maize
demand increases and as more beneficial traits become available and approved.
Biotech cotton was grown on 9.0 million hectares (11% of global biotech
area) compared with 7.2 million hectares in 2003. Bt cotton is expected
to continue to grow in 2005 and beyond, as India and China continue to
increase their hectarage and new countries introduce the crop for the
first time. Biotech canola occupied 4.3 million hectares (6% of global
biotech area), up from 3.6 million hectares in 2003. In 2004, 5% of the
1.5 billion hectares of all global cultivable crop land was occupied
by biotech crops.
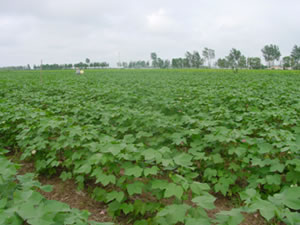
| CHINA Biotech Cotton |
|
Population: 1.3000m (1.3 billion)
% employed in agriculture: 50%
Agriculture as % of GDP: 15%
Area under biotech crops: 3.7 million hectares
|
Crop |
National Hectarage
'000 ha |
Biotech Hectarage
'000 ha |
Biotech % of Total Area Planted |
Cotton |
5,600 |
3,700 |
66 |
- During
the nine-year period 1996 to 2004, herbicide tolerance has consistently
been the dominant trait followed by insect
resistance.
In 2004, herbicide tolerance, deployed in soybean, maize, canola and
cotton occupied 72% or 58.6 million hectares of the global biotech 81.0
million hectares, with 15.6 million hectares (19%) planted to Bt crops.
Stacked genes for herbicide tolerance and insect resistance, deployed
in both cotton and maize continued to grow, occupying 9% or 6.8 million
hectares, up from 5.8 million hectares in 2004. The two dominant biotech
crop/trait combinations in 2004 were: herbicide tolerant soybean occupying
48.4 million hectares or 60% of the global biotech area and grown in
nine countries; and Bt maize, occupying 11.2 million hectares, equivalent
to 14% of global biotech area and also grown in nine countries. Whereas
the largest increase in Bt maize was in the USA, growth was witnessed
in all other eight countries growing Bt maize. Notably, South Africa
grew 155,000 hectares of Bt white maize for food in 2004, a substantial
25 fold increase from when it was first introduced in 2001. Bt/herbicide
tolerant maize and cotton both increased substantially, reflecting a
continuing trend for stacked genes to occupy an increasing area planted
to biotech crops on a global basis.
| INDIA
Biotech Cotton |
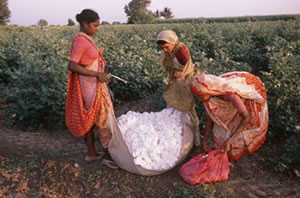 Pablo Bartholomew
 |
Population: 1,000m (1 billion)
% employed in agriculture: 67%
Agriculture as % of GDP: 23%
Area under biotech crops: 500,000 hectares
|
Crop
|
National
Hectarage
'000 ha
|
Biotech
Hectarage
'000 ha
|
Biotech
% of Total Area Planted
|
Cotton
|
9,000
|
500
|
6
|
- Another
way to provide a global perspective of the adoption of biotech crops
is to express the global adoption rates for the four principal
biotech crops as a percentage of their respective global areas. In 2004,
56% of the 86 million hectares of soybean planted globally were biotech
- up from 55% in 2003. Twenty-eight percent of the 32 million hectares
of cotton were biotech crops, up from 21% last year. The area planted
to biotech canola in 2004 was 19% of 23 million hectares, up from 16%
in 2003. Finally, of the 140 million hectares of maize grown globally,
14% was biotech in 2004 equivalent to 19.3 million hectares, up from
11% or 15.5 million hectares in 2003. If the global areas (conventional
and biotech) of these four principal biotech crops are aggregated, the
total area is 284 million hectares of which 29% was biotech in 2004,
up from 25% in 2003. Thus, close to 30% of the aggregate area of the
four crops, totaling over one quarter billion hectares is now biotech.
The biggest increase in 2004 was a 7.0 million hectares increase in biotech
soybean equivalent to a 17% year-on-year growth, followed by a 3.8 million
hectare increase in biotech maize equivalent to a substantial 25% year-on-year
growth, which follows a 25% year-on-year growth in 2003.
|
Menu:
|